
Introduction
This post introduces Richard Pollard in an account of the history of sport analytics. Richard completed his PhD at the University of the South Paciific in 1989. It was titled A statistical analysis of team performance at soccer. Richard’s 1997 paper (link), written with Charles Reep, gives an insight into his PhD. The paper explores the assessment of strategies during possession. Richard and Charles discuss how a quantitative variable is developed representing the probability of a goal being scored, minus the probability of one being conceded. This variable, called the yield, can be used to evaluate both the expected outcome of a team possession originating in a given situation, as well as the actual outcome of the possession. In this way, the effectiveness of different strategies occurring during the possession can be quantified and compared. (My emphasis.)
It is important that you meet Richard. He was a key figure in the development of analytics at Watford with Graham Taylor, Charles Reep and Simon Hartley (link). Richard introduced Charles to Graham and followed Simon’s work at Watford for two years after he left for the University of the South Pacific. He kept copies of Simon’s analyses.
Richard wrote the obituary for Charles Reep (2002) in the Journal of Sports Sciences (link). It was titled Charles Reep (1904-2002): pioneer of notational and performance analysis in football. Richard was particularly well placed to write this. He had known Charles since his time at school and had collected an archive of Charles’ work that in cluded letters and analyses.
As a result of his work in analysis, Richard was invited to give talks about analysis. One invitation came from Bhutan. In his report to Bhutan, Richard includes details of operational definitions, symbols and the practice of notation. These are very important documents in the real-time analysis of sport and takes us some way to understanding Charles Reep’s system.
Bhutan

In 2013, Richard was invited by the Crown Prince of Bhutan to visit the country and give a series of lectures on topics relating to sport and health. He gave six talks, one of which involved performance analysis in sport. Following that talk, they asked Richard to submit a report on how such analysis might be used to improve sports performance in Bhutan.
Richard submitted a report which contained details of the notational systems he used in football and tennis. Both systems were developed in the 1960s and Richard has used them ever since. These systems were inspired by Richard’s initial meeting with Charles.
Richard’s relationship with the Bhutan FA which lasted several years, following the talks he gave during the 2013 visit.
Richard’s Report to the Bhutan Olympic Committee
The purpose of Richard’s paper was to suggest how Bhutan, a small country with limited resources might be able to make use of performance analysis to improve the standard of play of sports overseen by the Bhutan Olympic Committee.
The term notational analysis in the context of sports refers to the technique of recording by hand, or computer, the actions of competitors during a sporting contest. This is done as an aid to performance analysis which has the broader aim of improving individual and team performance and ultimately developing optimal strategies of play.
In his report, Richard observed that the first person to develop a sophisticated system of carrying this analysis out for any sport was Charles Reep. In the early 1950s, he devised a comprehensive shorthand notation for recording on paper every on-the-ball action that took place during a football match. Careful analysis of the information recorded in this way enabled Charles to isolate specific actions and patterns of play most likely to lead to shots and goals. From these findings, he then devised a system of play that was subsequently used by a series of professional coaches in England with unprecedented success.
He added that the sporting world was slow to recognize the feasibility and use that could be made from notational and performance analysis. It was not until the 1980s, aided by the advent of video recordings and computerized recording devices, that performance analysis began to be incorporated into the coaching techniques applied both for football and other sports.
Richard pointed out in his report that his experience was mostly in football, and to a lesser extent, cricket and tennis. His report dealt with these three sports in some detail. His emphasis was on ways in which notational systems could be implemented at very low cost by hand and how the results could be used to improve the performance of individual players and in particular team performance.
Richard provided guidelines for the analysis of football. He suggested that the performance analyst notated the actions on the field, live in person at the match and not from a video recording. He noted that the advantage of a video recording, if available, is that is could be played, in slow motion if necessary, in order to make sure that the record of the game is as accurate and detailed as required.
He proposed that the best place for the analyst to sit is as high up as possible and as central as possible, ideally with the centre line directly in front. This provides a panoramic view of the play, similar to what is normally shown on television from the dominant camera view.
Richard noted that an essential feature of the system was to record whenever the ball entered the ‘shooting area’. The diagram he used was:

He suggested that when seated in a position from which the game was recorded, the analyst familiarised himself/herself with the visual cues which enabled the analyst to know immediately the ball entered the shooting area.
The analyst required a pad of paper with a line drawn down the centre. Richard provided an example of a ten-minute transcription:
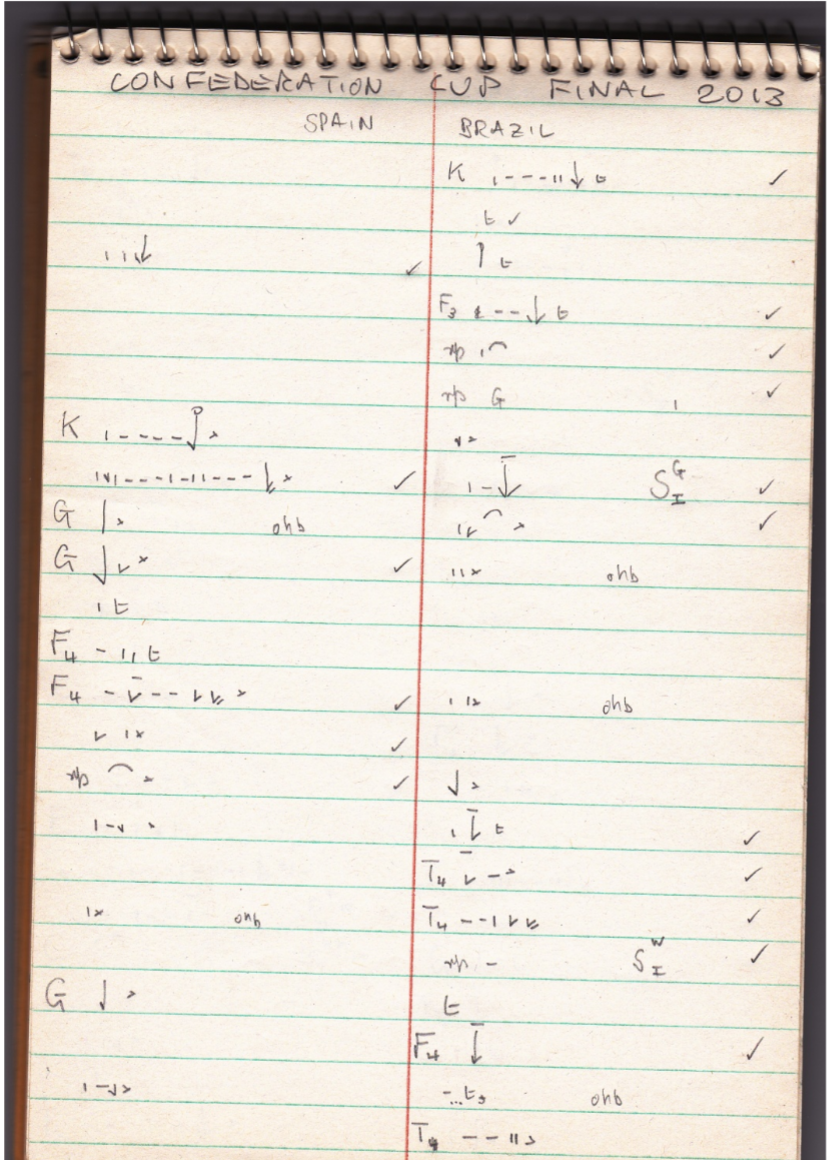
The action of the team playing from left to right is on the left side of the line, the other team on the right. Each half of each line represents a single team possession, consisting of a number of passes or other actions, such as a shot, that make up the team possession which ends when the team no longer has control of the ball, or it goes out of play.
Richard recommended these operational definitions:
PASS An attempt by one player to transfer the ball to another player of the same side. If the pass is successful and results in the second player gaining controlled possession of the ball, it is said to be RECEIVED. Otherwise the pass is NOT RECEIVED. LONG PASS A pass which directs the ball at least 30 metres closer to the opponents’ goal-line. SHORT PASS A pass which carries the ball forward, but less than 30 metres in the direction of the opponents’ goal-line. BACK or SQUARE PASS These are passes that do not carry the ball closer to the opponents’ goal-line.
PASSING MOVEMENT (same as TEAM POSSESSION or ATTACK) A series of passes between players of the same team which continues until one of the following events occurs:
- The ball goes out of play.
- A shot at goal is taken.
- The ball touches a player of the opposing team (for example by means of a tackle, a pass being intercepted or a loose ball being created). A momentary touch which does not significantly change the direction of the ball is excluded.
- An infringement in the rules takes place (e.g. a foul is committed, or a player is ruled offside).
CONTROLLED POSSESSION If a player is able to make a deliberate decision as to what he wants to do with the ball, and carries this out, then controlled possession is said to have taken place. Examples of uncontrolled possession are a wild kick at the ball when off balance, a headed clearance under pressure so that the direction of the clearance cannot be controlled, or the ball striking a player so that he cannot control its subsequent path.
GOAL-CLEARANCE A pass made by the goalkeeper after first picking up the ball.
RUNNING WITH THE BALL One player advances by running with the ball at or near his feet for a distance of at least 10 metres. Walking or jogging with the ball is excluded
FORWARD OPEN SPACE A constantly changing rectangular area formed by the goal-line, the touch-lines and the defending player nearest to the goal-line other than the goalkeeper. A pass into forward open space occurs when the attacking team plays the ball into this space.
SET-PLAY A passing movement which is started by the ball being kicked or thrown from a static position as in a goal-kick, free-kick, corner-kick, throw-in or kick-off. OPEN-PLAY Anything other than a set-play.
SHOT A direct attempt to score a goal resulting in a player striking the ball towards the opponents’ goal. Shots immediately blocked by a player other than the goalkeeper are not considered as shots. SHOT ON TARGET A shot that either results in a goal, or is saved by the goalkeeper. Shots which hit a post are not considered on target. SHOOTING-AREA The part of the field within 35 yards (about 32 metres) from the opponents’ goal-line. (As indicated in the field of play in figure) .
REACHER Any passing movement during which the ball enters the shooting area. WIDE REACHER A reacher which contains possession between the side edge of the penalty area and the touch-line (‘wide left’ and ‘wide right’ areas in zones 5 and 6 in field of play figure). REGAINED POSSESSION REACHER A reacher which originates within the shooting area. These can either be from set plays (corner, free kick, penalty, throw-in) or from open play. PITCHER A kick from the goalkeeper that directly reaches the shooting area.
CENTRE (or CROSS) A pass made from within about 15 metres from the touch-line with the intent of directing the ball into the centre of the penalty area in front of goal. Long throw-ins can count as centres. HARD, LOW CROSS A centre driven hard and below knee height, across the face of goal, parallel or at a narrow angle to the goal-line.
OWN HALF BREAKDOWN A passing movement that breaks down in a team’s own half of the field.
Richard noted in his report that the system used symbols to record the on-the-ball action of a game.

He suggested that these symbols could be changed to suit the person doing the recording, but he confirmed that it was important to make sure that the details of every pass, centre and shot were accurately recorded with recognisable symbols. He recommended that two people work together, one as chief recorder and the other to give help as needed, but also to keep a chart of the exact location of shots at goal and other information about each shot.
Richard recognised that the skills involved to record a game by hand would take time to perfect. He suggested that an analyst started by attempting to get the basic actions recorded on paper and then slowly add more and more details as he or she becomes more proficient. Video recordings of previous games were available on the internet and these could be used to practice hand-recording a game. He thought that to get started, it may be advisable to record just the actions of one of the teams.
He suggested that after the game, the analyst should go through the recording and annotate with the symbols.
- rp Regained possession inside the shooting area
- ohb Own half breakdowns
- ‘Reachers’ (passing moves reaching shooting area, within 35 yards of goal line)
Having done this, Richard suggested, a summary of the recording can be made consisting of a number of ‘performance indicators’, known to give important information about team performance in the match. This is done by going through the recording and counting the number of times each event occurs. He suggested that with practice this should take no longer than one hour.

He added that an optimal style of play has been identified for which these performance indicators provide crucial quantitative information. There are target figures for each performance indicator. For example, a minimum of 20 shots, at least 10 of which are from inside the penalty area.
Richard’s report also included suggestions about cricket and tennis and how approaches to these sports might be adapted to other sports.
Conclusion
Richard is a key figure in our history of analytics. He knew Charles Reep, Simon Hartley very well and was an integral part of the development of analytics at Watford.
His report to Bhutan includes details of operational definitions, symbols and the practice of notation. These are very important documents in the real-time analysis of sport and takes us some way to understanding Charles Reep’s system.

Photo Credits
All photographs in this post were provided by Richard Pollard.
Bhutan photo by Pema Gyamtsho on Unsplash


