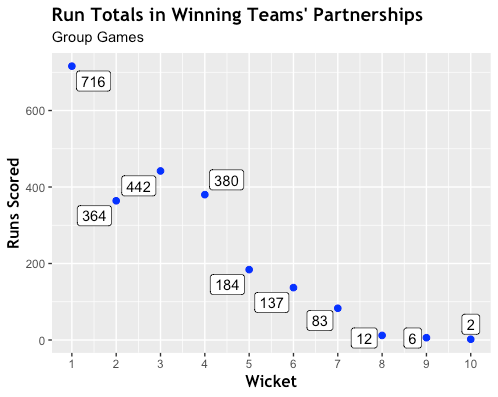
In the lull between the Group Games and the semi-finals of the Women’s T20 Cricket World Cup, I have been looking at the data I have collected and trying out some ggplot visualisation.
My attempts with the ggridges package failed and I am going to re-try. But in the meantime, here are two comparisons that use the ggrepel package. My data are for the total runs scored in each wicket partnerships. The data do not include the games decided by Duckworth-Lewis methods (England v Bangladesh).


I used Baptiste Auguie’s suggestions for laying out multiple plots (two in my case) and installed the grid and gridExtra packages to help me.


