Introduction
The Chiefs, Bulls, Brumbies, Crusaders, Reds and Cheetahs have made it to the 2013 Super 15 Rugby Union Playoffs.
This weekend the Crusaders play the Reds in Christchurch and the Brumbies play the Cheetahs in Canberra.
I was interested in the ways all these teams made it to the finals.
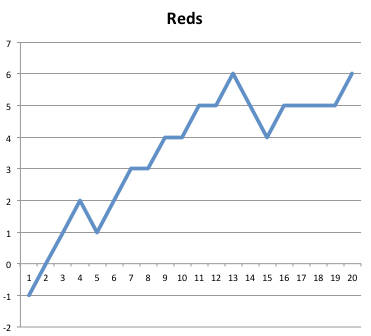
I looked at each team’s performance and allocated +1 for a win, 0 for a draw or bye and -1 for a defeat.
Overall the six teams together look like a London Underground map … all heading for Epping, and the top of the table.

The Teams
The Chiefs

The Bulls

The Brumbies

The Crusaders

The Reds

The Cheetahs

Some Comparisons
Chiefs and Bulls

Brumbies and Crusaders

Reds and Cheetahs


I’m not sure what your Y-axis measures, but it’s not ‘cumulative points’, because something that’s cumulative only increases; it never declines, yet your graph has the value declining and even going into negative numbers.
Hello, Stephen
Thank you for finding the post and for making this point. I was looking to visualise a journey that might have a negative value. I thought the use of a very simple points system would indicate trend.
Best wishes
Keith